NVIDIA GPU profiling with Rust
Not too long ago, I had to perform CPU and GPU profiling in support of rendering a thesis1. When I realized the ecosystem of GPU profiling tools in Rust was somewhat immature, I had to scaffold my own tools out of necessity. This post will demonstrate how anyone can use the NVIDIA Tools Extension SDK (NVTX) from Rust to make GPU and CPU profiling trivial.
Introduction to NVTX
NVTX is a C-based API for annotating events, code, and resources in your application. These annotations get captured by NVIDIA profiling software, such as NSight Systems2. Emitting tracer annotations during the runtime of your program can help identify key issues such as hardware starvation, insufficient parallelization, expensive algorithms, and more. Later in this post we will explore an example (#show-me).
Thankfully, one of Rust’s promises is its ability to interoperate with C APIs through foreign function interfacing (FFI) at identical performance3. This is called a zero-cost abstraction, and allows us to call NVTX functions with identical performance to C, in Rust.
NSight Systems
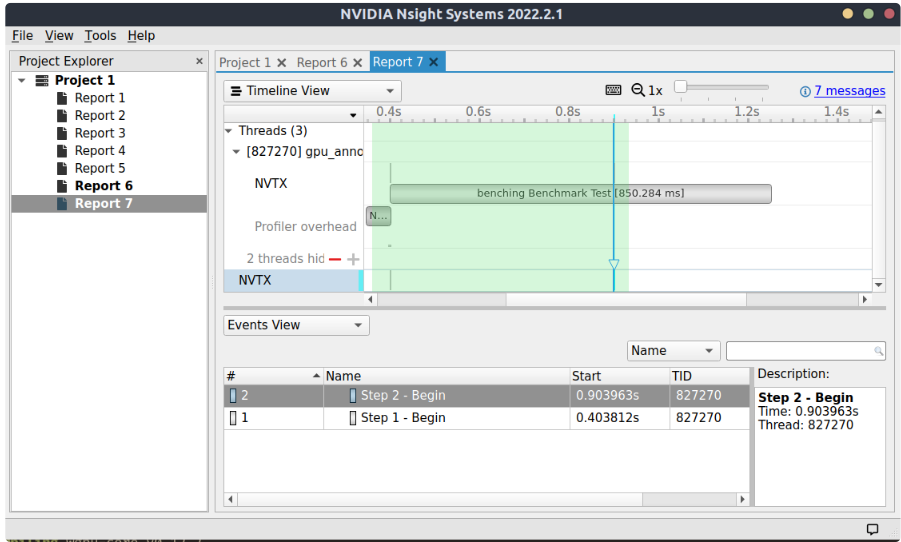
NSight Systems is a feature-ruch CLI and GUI profiler which executes a command and samples certain opt-in measurements you subscribe to. For example, if I instruct NVIDIA Nsight Systems to run a binary, Nsight Systems will launch the binary on my behalf, collect measurements while waiting for termination, and deliver a report file. In that order.
These reports can be better understood with annotations from my nvtx crate. With it, you may name your threads, add markers, and annotate timespans. Tracers emitted during program runtime appear on the NVTX layer of a report file when capturing NVTX annotations. The following image shows an example of some tracers, with nothing else captured.
Code
The following sections provide some examples which demonstrate how trivial it is to augment runtime with annotations.
Markers
Firstly, I will show markers. Markers are used to tag instantaneous events during the execution of an application. For example, dropping a marker can be used to annotate a step in an algorithm.
Markers are injected with the mark! macro, which accepts a name for the event. It behaves similarly to the println! macro with argument formatting.
use std::thread::sleep;
use std::time::Duration;

use nvtx::mark;

fn main() {
    mark!("Operation A - Begin");
    sleep(Duration::from_millis(150)); // Expensive operation here
    mark!("Operation B - Begin");
    sleep(Duration::from_millis(75)); // Expensive operation here
}

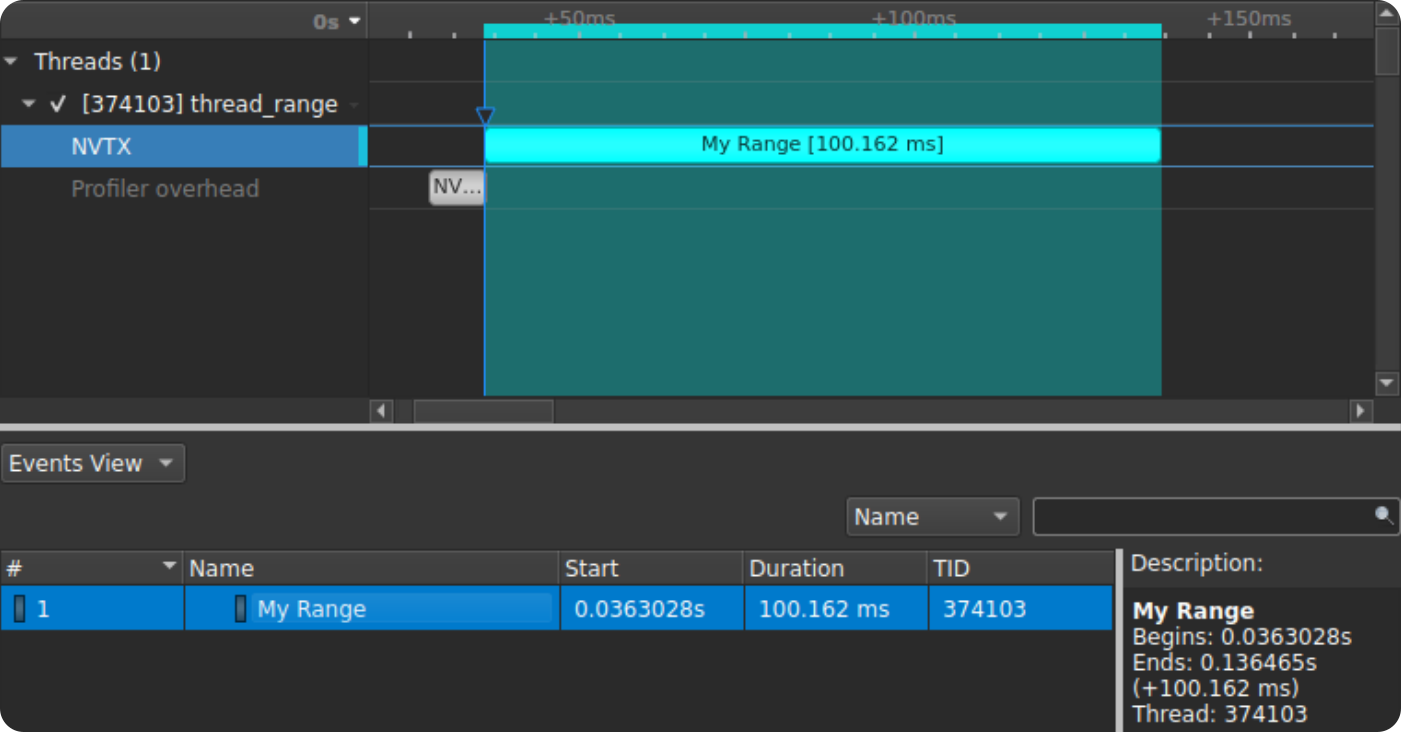
Thread ranges
Thread ranges are similar to markers, except they annotate a span of time, rather than an instant of time. For example, a thread range can track the total time of an algorithm or process.
Ranges are pushed with the range_push! macro, and popped with the range_pop! macro. Thread ranges are also safe to push and pop over thread boundaries, hence thread in the name.
use std::thread::sleep;
use std::time::Duration;

use nvtx::{range_pop, range_push};

fn main() {
    range_push!("My Range");
    sleep(Duration::from_millis(100)); // Expensive operation here
    range_pop!();
}
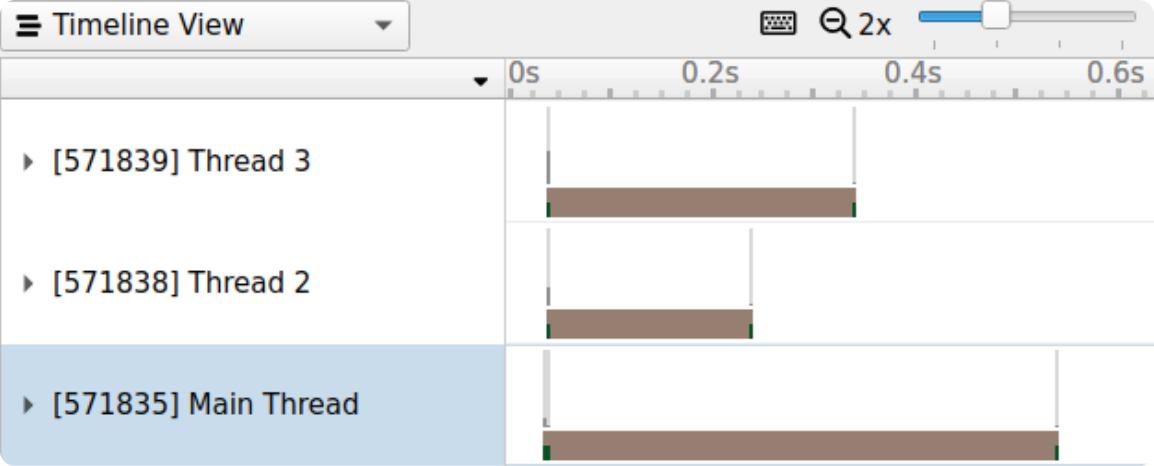
Thread naming
Lastly, threads can be named with the name_thread! macro. This macros will alias the calling OS thread with a friendly name. Currently, this macro works cross-platform and has been tested on MacOS, Windows, Linux, and Android.
use std::thread::sleep;
use std::time::Duration;

use nvtx::name_thread;

fn main() {
    name_thread!("Main Thread");
    let handler2 = thread::spawn(|| {
        name_thread!("Thread 2");
        sleep(Duration::from_secs_f32(0.2));
    });
    let handler3 = thread::spawn(|| {
        name_thread!("Thread 3");
        sleep(Duration::from_secs_f32(0.3));
    });
    sleep(Duration::from_secs_f32(0.5));
    handler2.join().unwrap();
    handler3.join().unwrap();
}
Show me
To demonstrate NSight Systems, NVTX, and Rust, I will present a finding I organically stumbled upon when writing a naive SVG renderer using Lyon and wgpu.
Situation
My task was assessing if tessellation could have any usefulness in optimizing vector graphics. Vector graphic renderers solve a very complicated problem; they don’t simply read rows of pixels like in raster graphics. You may imagine an SVG file as a composition of overlapping paths and lines, and a renderer must decide on varyings (scale, viewbox, etc.) to calculate the image.

Vector tessellation makes this easier. The idea is to transmute mathematical paths, curves, and lines into discrete triangles, a friendlier format for GPUs. My renderer would cache the triangle geometry in a storage buffer and re-use the work to inexpensively redraw the SVG.
I chose some sample images as an organic range with varying complexity, and proceeded to benchmark the frametimes.

Results
The benchmark was simple: render 50 frames and record how long each frame took. The results are plotted below.

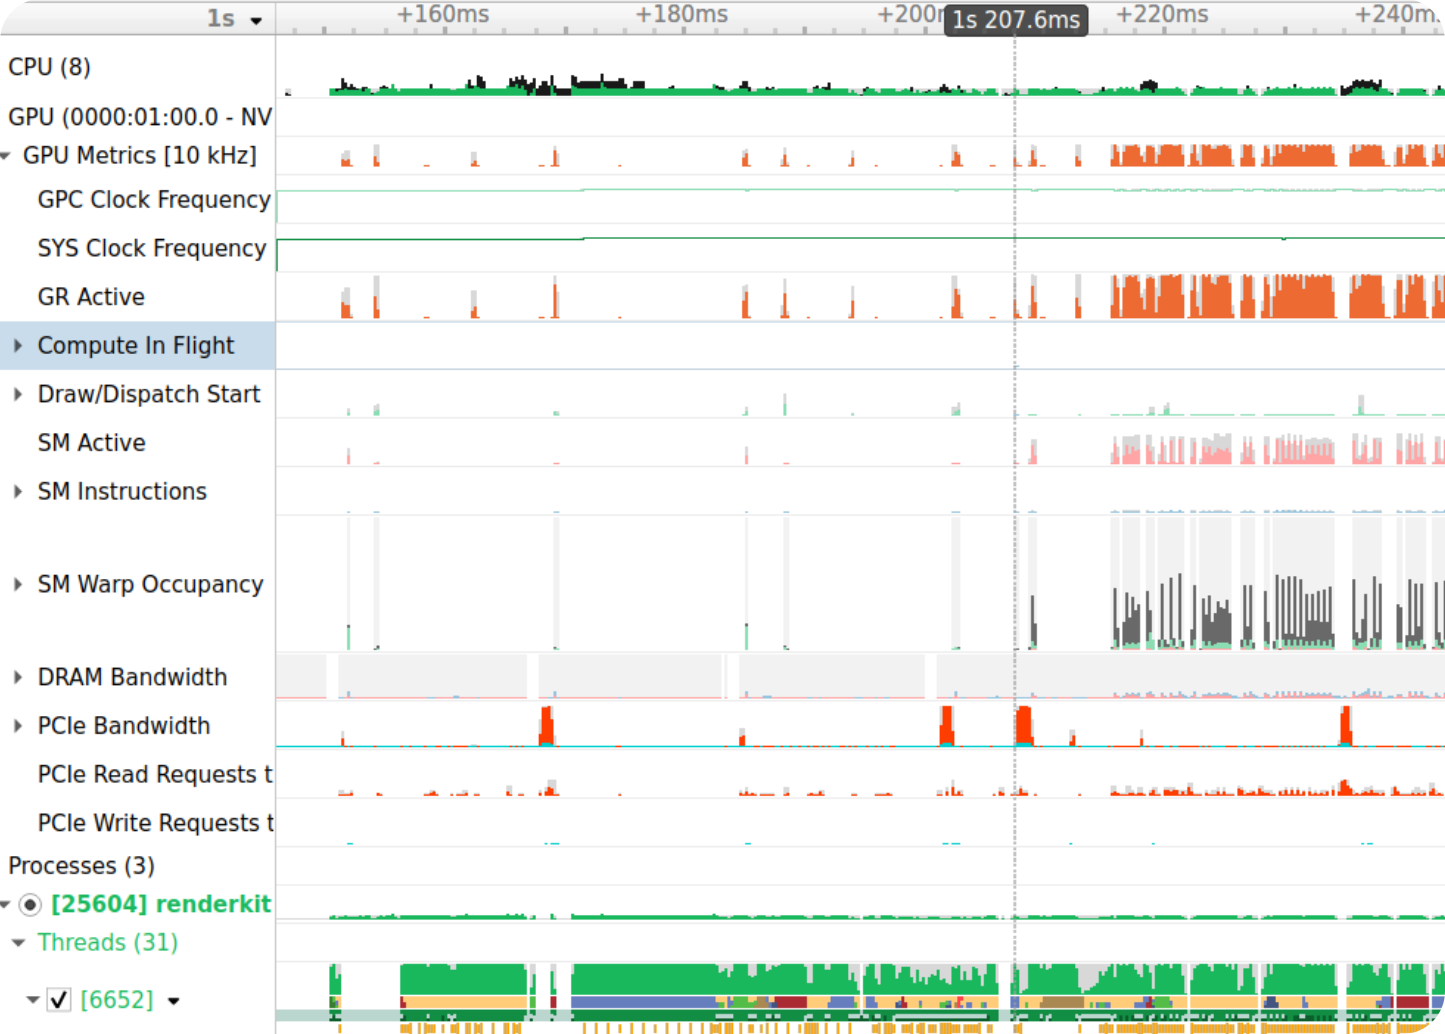
Tessellation-time was not plotted here, and no frame was rendered any differently. So to my surprise, why was the first frame taking longer? Using the power of NVTX annotations, I dropped some tracers to understand the instructions temporally. I annotated the first frame as “Strange Behavior”.
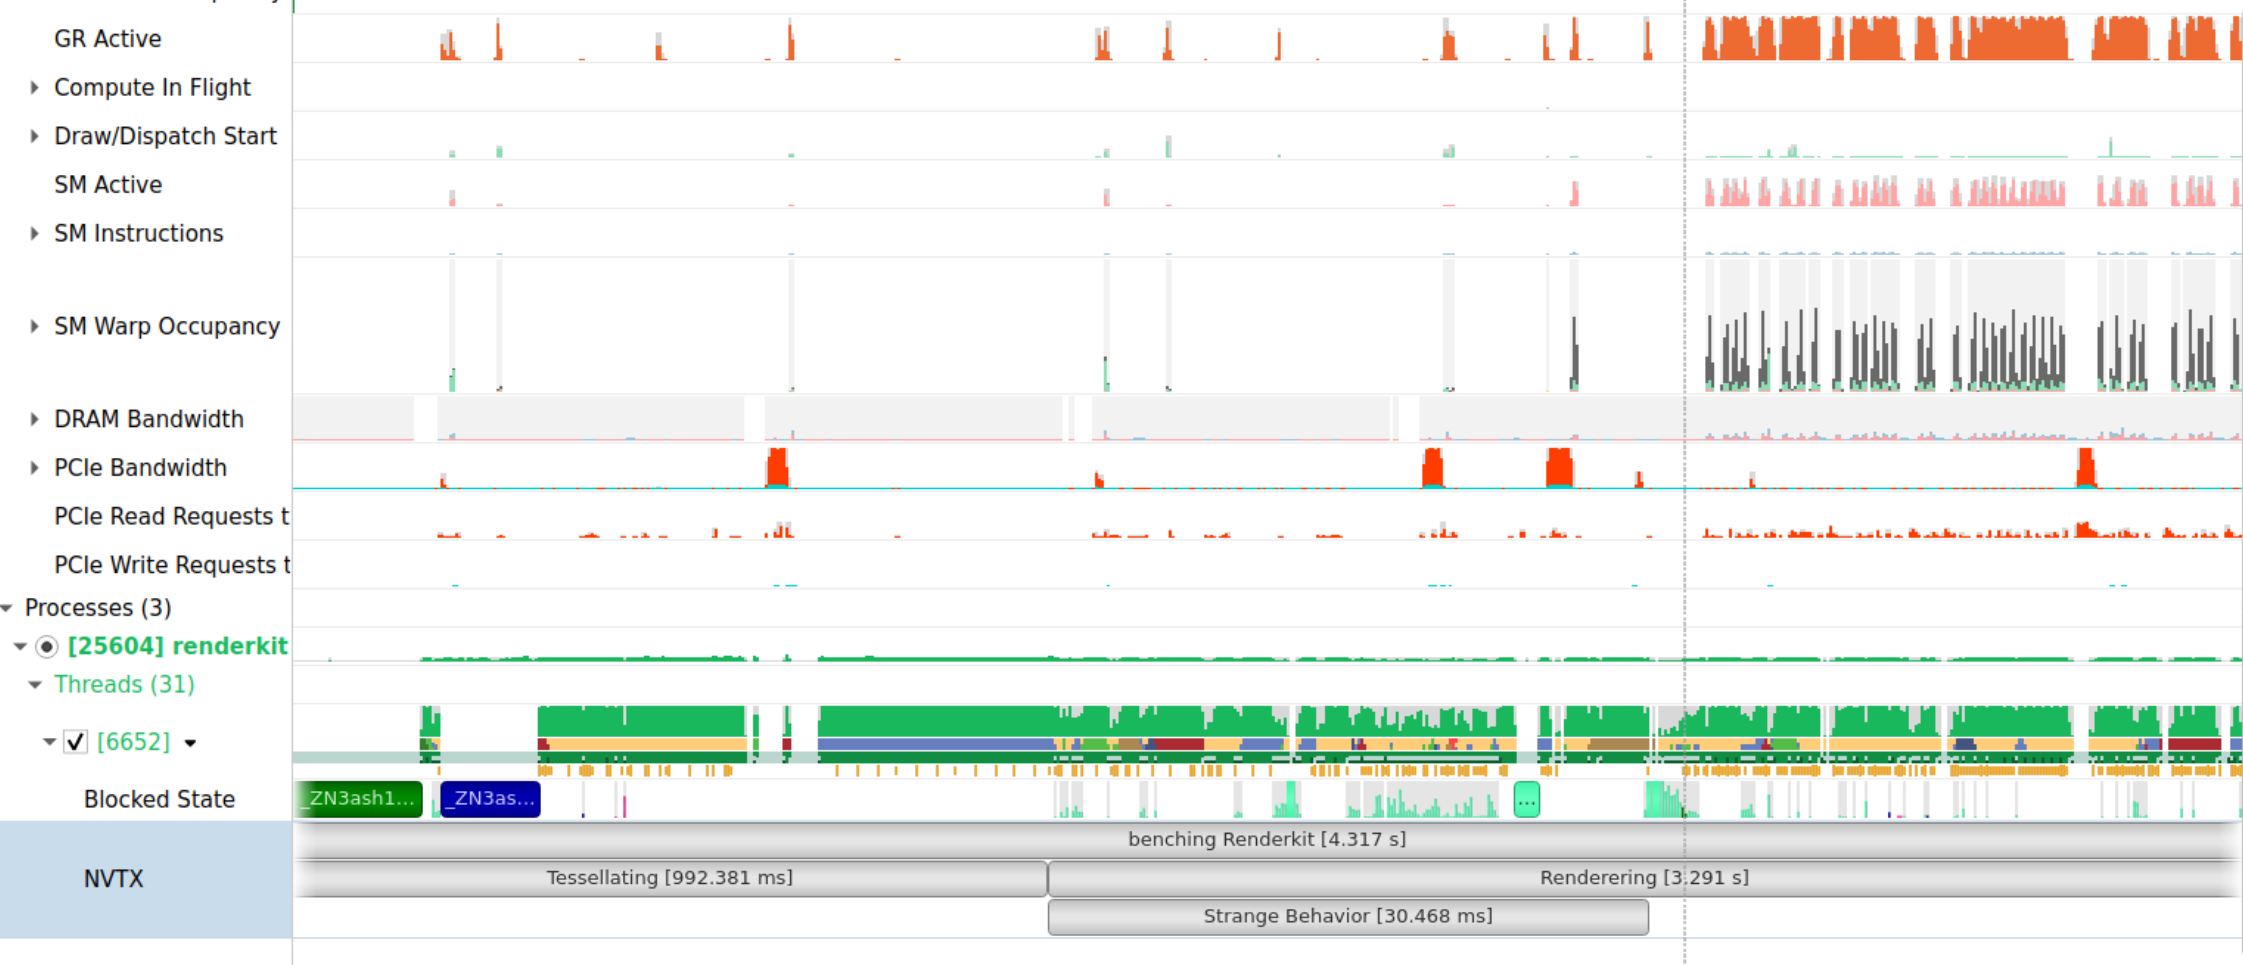
To my surprise, it seemed like the GPU wasn’t working hard until the 2nd frame. The reasoning would be that wgpu (the graphics library I used) submitted the queue of geometry in the first frame. What we are witnessing is gpu latency, specifically, the time to transfer the geometry to the GPU storage buffers and return. This became an obvious que when able to inspect and see a timeline with ques: blocked state, PCIe bandwidth, and GPU occupancy.
This is one example of how annotations have helped me, and work will continue to help in more ways.
Features in progress
I have only ported a fraction of the NVTX SDK, and there are some noteworthy features outstanding. NVTX can be used to measure CPU code blocks, track lifetime of CPU resources (e.g., malloc), log critical events4, and more. I’d love to port filtering tracers by domains and resource naming. Feel free to contribute or check out the issue board.